


-
- 거래 조건
- 계좌유형
- 스프레드, 비용 & 스왑
- 입금 & 출금
- 수수료 & 요율
- 거래 시간
-
- 회사소개
- 회사개요
- PU Prime 리뷰
- 공지사항
- 뉴스룸
- PU Prime에 연락하기
- 고객센터


KR
26 June 2025,05:51
Chart The Market
26 June 2025, 05:51


ETH, H4:
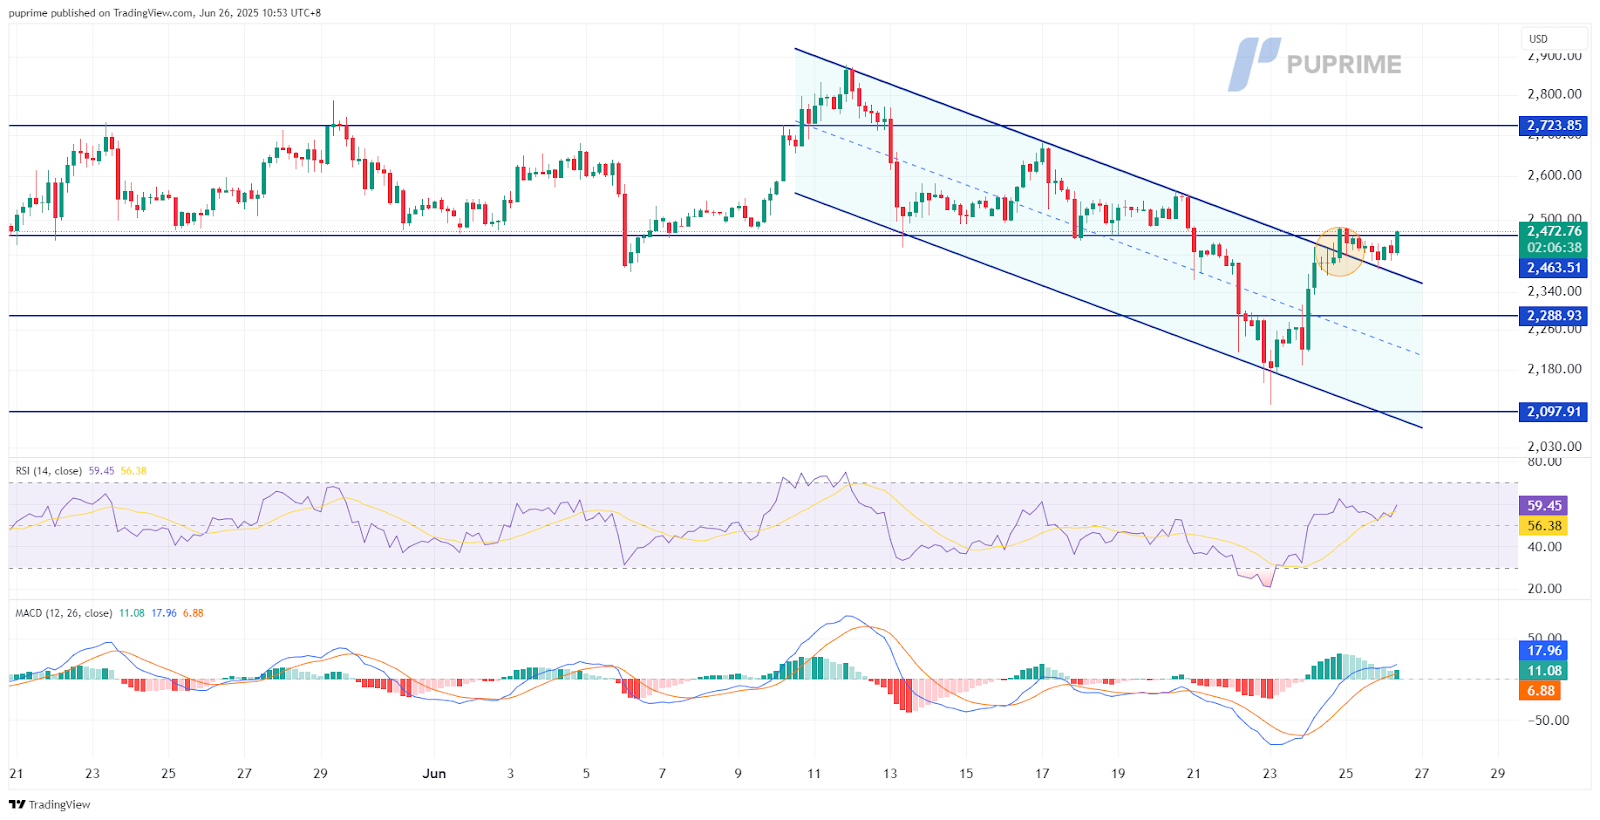
Ethereum (ETH) has emerged from a turbulent period with technical indicators now pointing to a potential bullish reversal. The cryptocurrency recently experienced a dramatic false breakout scenario – initially breaking above its sideways trading range only to suffer a steep 26% collapse from $2,879 to $2,111.64. This whipsaw action shook out weak hands but may have set the stage for a more sustainable recovery.
The most encouraging development comes from ETH’s recent ability to break and hold above its descending trend channel, a technical pattern that had previously contained prices during the downtrend. This breakout, combined with the establishment of support above the former resistance line, suggests the bears may be losing control. The significance of this technical development shouldn’t be underestimated – sustained trading above this level often marks legitimate trend reversals rather than temporary rallies.
Momentum indicators corroborate the improving technical picture. The Relative Strength Index (RSI) has completed a notable journey from oversold conditions to now trading firmly above the midpoint (50 level), demonstrating building upside momentum. Meanwhile, the Moving Average Convergence Divergence (MACD) has executed a bullish golden cross at depressed levels and has now powered above the zero line – a classic confirmation of shifting momentum from bearish to bullish territory.
This technical setup presents ETH with an opportunity to regain its bullish narrative. However, traders should remain cautious of potential retests of the breakout level, which would be healthy but could shake out impatient investors. Volume analysis will be crucial – sustainable moves higher should be accompanied by increasing trade volume to confirm genuine buying interest rather than short covering.
Resistance Levels: 2723.85, 3037.30
Support Levels: 2288.90, 2097.90

GBPJPY, H4
The GBP/JPY pair continues to exhibit robust bullish momentum, having successfully broken through the critical 196.25 resistance level that had previously capped multiple upside attempts. This decisive breakout marks a significant technical development, confirming the pair’s upward trajectory that has been in place since its April 2025 lows. The sustained trading above both the psychological 196.00 level and the ascending trendline support underscores the strength of the current uptrend.
Following its ascent to fresh 2025 highs, the pair experienced a modest technical retracement that found firm support at the 23.6% Fibonacci retracement level. The shallow nature of this pullback and subsequent swift recovery speaks volumes about the underlying buying pressure, suggesting market participants remain eager to accumulate positions on minor dips. This behavior typically characterizes strong trending markets where investors view temporary setbacks as opportunities rather than threats to the prevailing direction.
Momentum indicators continue to support the bullish case, though they warrant careful monitoring. The Relative Strength Index (RSI) persists near overbought territory, reflecting sustained upward pressure while still leaving room for additional gains before reaching extreme levels. Meanwhile, the Moving Average Convergence Divergence (MACD) maintains its upward trajectory, with both the MACD line and signal line trending higher above the zero line – a classic configuration seen in healthy uptrends.
The current technical landscape suggests the path of least resistance remains to the upside, with the next significant resistance levels coming into view at the 198.70 mark and potentially the major psychological 200.00 level beyond that. However, traders should remain mindful that extended runs often see periodic corrections, and the pair’s proximity to overbought conditions suggests volatility may increase near these higher levels.
Resistance Levels: 198.70, 200.60
Support Levels: 196.20, 194.10

업계 최저 스프레드와 초고속 실행으로 FX, 지수, 귀금속 등을 거래하실 수 있습니다!
거래 플랫폼
배우다
PU Prime 소개
기업의

Please note the Website is intended for individuals residing in jurisdictions where accessing the Website is permitted by law.
Please note that PU Prime and its affiliated entities are neither established nor operating in your home jurisdiction.
By clicking the "Acknowledge" button, you confirm that you are entering this website solely based on your initiative and not as a result of any specific marketing outreach. You wish to obtain information from this website which is provided on reverse solicitation in accordance with the laws of your home jurisdiction.
Thank You for Your Acknowledgement!
Ten en cuenta que el sitio web está destinado a personas que residen en jurisdicciones donde el acceso al sitio web está permitido por la ley.
Ten en cuenta que PU Prime y sus entidades afiliadas no están establecidas ni operan en tu jurisdicción de origen.
Al hacer clic en el botón "Aceptar", confirmas que estás ingresando a este sitio web por tu propia iniciativa y no como resultado de ningún esfuerzo de marketing específico. Deseas obtener información de este sitio web que se proporciona mediante solicitud inversa de acuerdo con las leyes de tu jurisdicción de origen.
Thank You for Your Acknowledgement!