


-
- 거래 플랫폼
- PU Prime 앱
- PU 카피트레이딩
- PU 소셜
-
- 거래 조건
- 계좌유형
- 스프레드, 비용 & 스왑
- 입금 & 출금
- 수수료 & 요율
- 거래 시간
-
- 회사소개
- 회사개요
- PU Prime 리뷰
- 공지사항
- 뉴스룸
- PU Prime에 연락하기
- 고객센터


KR
24 September 2025,07:25
Chart The Market
24 September 2025, 07:25


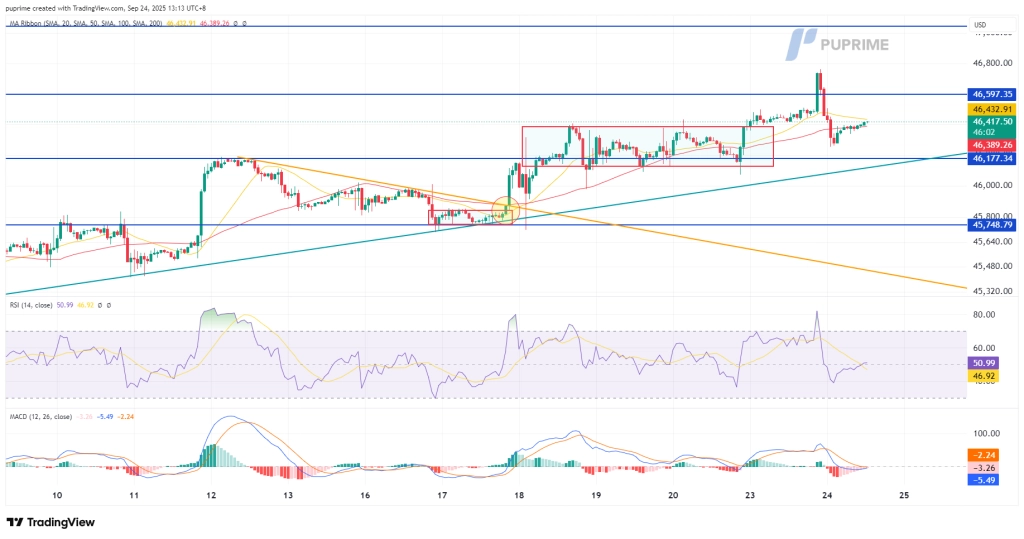
Dow Jones, H4:
The Dow Jones Industrial Average declined 1% in the previous session, retreating from its all-time high of 46,763 as investors engaged in profit-taking near peak levels. The sell-off pushed the index below its prior swing low, suggesting a near-term shift in momentum and raising the potential for a deeper corrective phase.
The index is now testing crucial support at the 46,130 level, which represents the lower boundary of its recent consolidation range. A sustained hold above this level would indicate that the broader bullish structure remains intact, while a breakdown could signal a more significant pullback toward the next support zone near 45,750.
Momentum indicators have turned notably weaker. The Relative Strength Index has declined below its midline, reflecting diminishing buying pressure, while the Moving Average Convergence Divergence is on the verge of crossing below its zero line—a development that would confirm deteriorating near-term momentum.
Resistance Levels: 46,600.00, 47,050.00
Support Levels: 46,150.00, 45,750.00
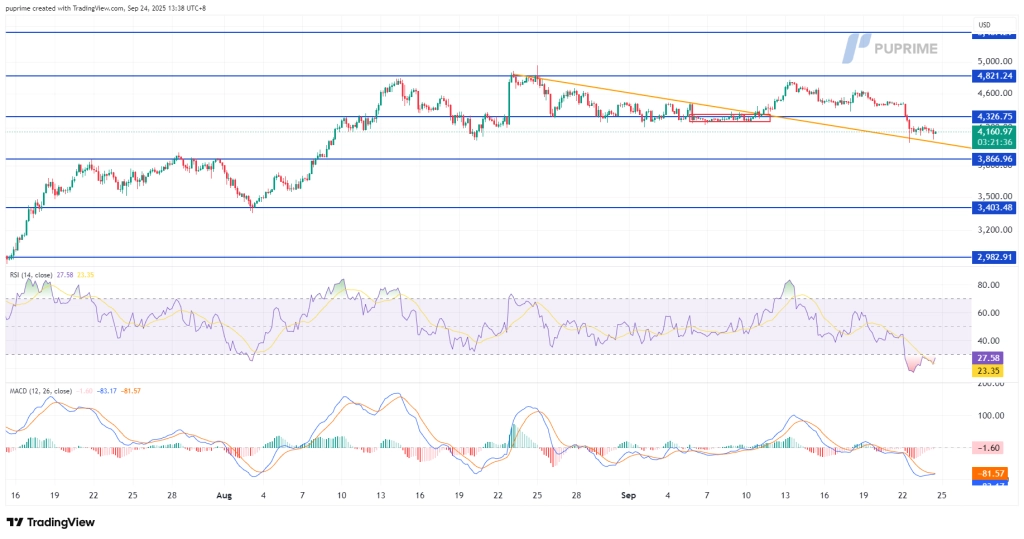
ETH, H4
Ethereum has decisively broken its bullish technical structure, declining more than 10% early in the week and falling below the critical liquidity zone near $4,300. The breakdown confirms a shift to a bearish near-term bias, with the cryptocurrency now trading in a sideways pattern as it consolidates following the sharp sell-off.
A break below the current consolidation range would reinforce the negative outlook and potentially trigger a deeper correction toward the next significant support level near $4,000. The move reflects a combination of factors, including broad-based profit-taking in digital assets, unwinding of overleveraged long positions, and deteriorating short-term momentum.
Momentum indicators are aligned with the bearish price action. The Relative Strength Index has entered oversold territory, indicating intense selling pressure, while the Moving Average Convergence Divergence has crossed below its zero line and continues to trend lower, confirming that downward momentum is accelerating.
Resistance Levels: 4326.00, 4821.00
Support Levels: 3867.00, 3403.00

업계 최저 스프레드와 초고속 실행으로 FX, 지수, 귀금속 등을 거래하실 수 있습니다!
거래 플랫폼
배우다
PU Prime 소개
기업의


Please note the Website is intended for individuals residing in jurisdictions where accessing the Website is permitted by law.
Please note that PU Prime and its affiliated entities are neither established nor operating in your home jurisdiction.
By clicking the "Acknowledge" button, you confirm that you are entering this website solely based on your initiative and not as a result of any specific marketing outreach. You wish to obtain information from this website which is provided on reverse solicitation in accordance with the laws of your home jurisdiction.
Thank You for Your Acknowledgement!
Ten en cuenta que el sitio web está destinado a personas que residen en jurisdicciones donde el acceso al sitio web está permitido por la ley.
Ten en cuenta que PU Prime y sus entidades afiliadas no están establecidas ni operan en tu jurisdicción de origen.
Al hacer clic en el botón "Aceptar", confirmas que estás ingresando a este sitio web por tu propia iniciativa y no como resultado de ningún esfuerzo de marketing específico. Deseas obtener información de este sitio web que se proporciona mediante solicitud inversa de acuerdo con las leyes de tu jurisdicción de origen.
Thank You for Your Acknowledgement!